

Metrics
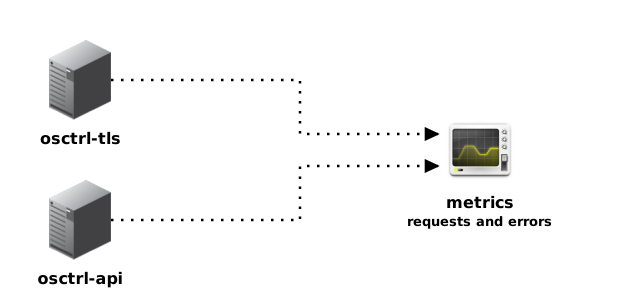
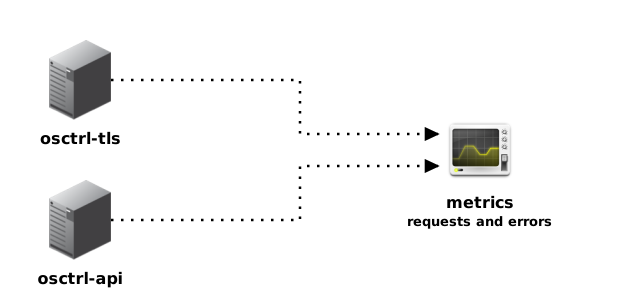
The metrics component of osctrl provides instrumentation for the following operations:
- Receiving requests to osctrl-tls,
- Receiving requests to osctrl-api,
- Generating errors during normal operations in osctrl-tls and osctrl-api.
The default provisioning of osctrl does install InfluxDB + Telegraf + Grafana to act as the metrics component, but any monitoring solution that follows the push model, should work as well.
osctrld metrics
Section titled “osctrld metrics”With --metrics-enabled and osctrld.enabled, osctrl-tls also exports gauges and counters about hosts running osctrld:
| Metric | Type | Meaning | Aggregate across replicas |
|---|---|---|---|
osctrld_osquery_down{environment} |
gauge | Nodes whose report is under 15 minutes old and says osqueryd is down |
max by (environment) |
osctrld_osquery_behind{environment} |
gauge | Nodes below their effective osquery target (registered when the version library is enabled) | max by (environment) |
osctrld_osquery_rollout_paused{environment} |
gauge | 1 while the environment’s latest rollout is paused | max by (environment) |
osctrld_rollbacks_total{environment,kind,stage} |
counter | Flags/extensions rollbacks reported by hosts | sum |
osctrld_osquery_upgrade_rollbacks_total{environment} |
counter | osquery upgrades rolled back | sum |
The gauges are read from the database (read replica when one is configured), so every replica exports the same value; a database error exports nothing for that scrape. Pair an alert on them with an absent() rule if a database outage must not resolve it.